Many different factors can affect the way that we experience a building — the amount of light, the proportions of the rooms, the positioning of doorways and corridors, surfaces, and even our personality type.
It is the job of architects to take control of these elements to create buildings that are a pleasure to use.
Although the formula for creating a positive experience within a space may seem intuitive — plenty of light, generous proportions, an easily navigable floor plan, a balance of private and social spaces — very often, these basic needs are overlooked. And that can have an impact on occupants’ physical and mental health.
Mapping space
UCA Architecture researcher and Programme Director Sam McElhinney has spent the last ten years investigating space analytics. At the heart of his effort is a piece of software called Isovist, which can simulate the viewpoint of a person in a space, and predict their behaviour within it.
Freely available from isovists.org, the programme can generate data to support the intuitive assumptions that architects make about how to design spaces that people will want to spend time in.
Isovist scans uploaded plans and sections to examine the overall structure of a space, measuring all of the routes and all of the views throughout it. It can then highlight the space’s configurational qualities.
“How a space is arranged has a fundamental effect on how we use it,” says McElhinney. “Space is not a neutral, empty thing — it’s filled with these fields, lines and different regions. Ultimately, when we design a building, we’re setting up a control system — we’re controlling where people will go.”
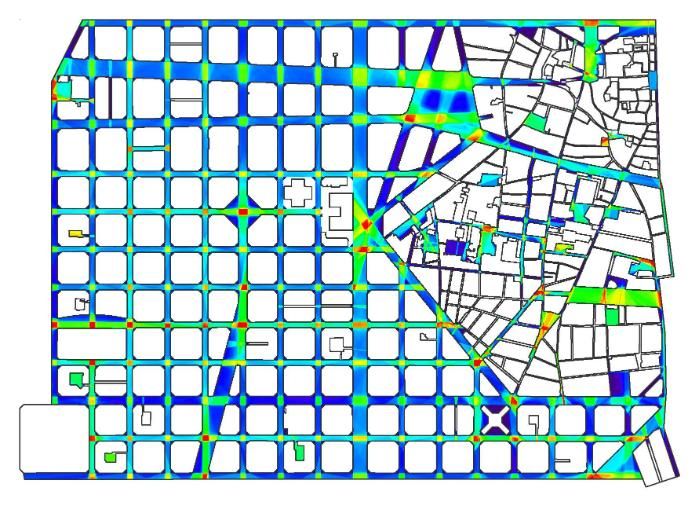
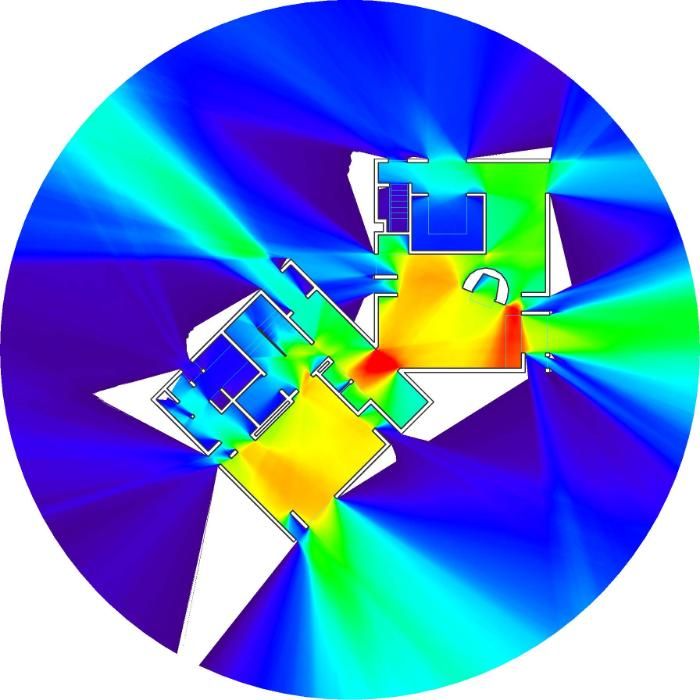
The data that the Isovist software measures are presented in the form of a heat map, overlaid onto floor plans and sections.

This mapping communicates information about the space that allows users to interpret how people are likely to move through it, where they are most likely to enjoy sitting and the areas that they will likely avoid, through a simple colour spectrum — red represents a high reading, and blue is low.
“The measures that it produces allow people to better understand how we might react to a space,” explains McElhinney. “Currently, architects are quite free to make assertions l based on intuition. My work isn’t about denying that intuition, but providing tools to examine it and test it.”
A tool for everyone
Having spent a large part of his career researching space analytics, McElhinney believed that existing software tools left a lot of room for improvement.
“One of my driving motivations is to make this field a bit more accessible,” he says. “The software to date has been very researcher-facing. You have to spend a lot of time exploring the programmes to really understand them and use them intelligently.
“Some of that is down to poor interface design, and some of it is down to a lack of education. An architect or designer doesn’t have five hours to dedicate to a spatial analysis at an early design stage, and so they tend to go on intuition.”
The science that Isovist and other space analytics programmes are based on was established in the 1970s and ’80s, but only became computerised in the early 2000s. Since then, software has largely been developed to analyse massive urban structures, neglecting individual buildings and spaces.

“There are two reasons for that,” states McElhinney. “One is that there is probably more research funding available for the analysis of large urban networks, and the other is that tracking movement across cities is somewhat less problematic — you can set up a point on the road and count people relatively easily. “
“When it comes to carrying out building studies, it’s a bit more challenging,” he continues. “You risk affecting human behaviour when you are in the building. Also, people are quite whimsical, so there are other factors at play like water coolers or individual characters that people may wish to avoid. There is much more observational work required at the building level than there is at the city level.”
Cutting-edge
In the Isovist software, McElhinney wanted to create a fast, user-friendly programme that could analyse much smaller areas and be used by a broader audience of architects, designers and students. The high-resolution mappings that the Isovist software produces are “cutting edge in terms of what can be done graphically,” he says. They are created in minutes rather than hours, and users can zoom in to the nearest centimetre, rather than the nearest metre.
The software is based upon Isovist, a scientific principle that was defined in a 1979 paper by Michael Benedikt from Austin, Texas; it defines an isovist as “a system of points visible from a single vantage location in space, with respect to an environment”.
Although the Isovist software’s conceptual basis is the same as other existing programmes, the way it calculates its mappings is different. “Whereas other space analytics software is based upon finite calculations — a set number of points that are sampled from and used to make calculations across a whole plan — the Isovist software uses cycles of calculation, a little like rendering, so that over time the mapping becomes more accurate, ” explains McElhinney. “After 250 samples, it’s really quite precise — it’s not definitive — nothing ever is — but it gives us insights into the experiences that people might have.”
Google Analytics is embedded within the software, so McElhinney is kept informed about how and where people are interacting with it. At the time of publication, it has been used more than 13,800 times this year — 38% more than in the previous 12 months. Its users are based in more than 50 countries across the world, with significant concentrations in the UK, India, the US, China, Mexico, the Netherlands and Iran.
By reaching out personally to some of the users, McElhinney has learned that they come from fields as diverse as architecture, archaeology and the military.
Putting it into practice
Closer to home, some UCA students have used the software to carry out their own studies.
Jack Harding, a former undergraduate who based his third-year thesis on Frank Lloyd Wright’s conviction that “the hearth is the psychological centre of the home”, used Isovist to re-examine this belief.
He used the software to map the local measures of connectivity, drift, occlusivity, and mean visual depth across the floor plans of three of Wright’s houses. Through the generated heat maps, he was able to conclude that the hearths, while not always placed near the geometric centre of the home, created their own symbolic centre because they are places of high connectivity; natural places for gathering, connections, and social interaction.
Another UCA undergraduate, Alice Bates, used Isovist software to prove that there is a series of spatial characteristics found in 1920s Paris and 1950s New York that have a strong correlation with the presence of creatives.
“My use of the programme strengthened my hypothesis and added a scientific backbone to my findings,” she recalls on Isovists.org. “I was blown away by the software’s ability to reliably flag up the precise locations of Hemingway and Kerouac’s favourite haunts as being places of particular spatial interest.”
As awareness around the software and its capabilities continue to grow, McElhinney hopes that more and more design studios will start to routinely use the Isovist software as part of their design process and that it will support the evidence-based design teaching that will help the next generation to create better more human-centred architecture.
/prod01/channel_8/media/marketing-media/blog-imagery/architecture-blog.jpeg)